
Key Takeaways
- Bitcoin’s price trades near $80,274 as nine moving averages favor sellers and five favor buyers.
- Bitcoin bulls must reclaim $80,900 to challenge $81,500 and $82,000.
- Bitcoin’s price risks a decline toward $78,000 if the $79,146 swing low breaks.
Bitcoin Price Battles $81,000 as Bears Defend the High Ground
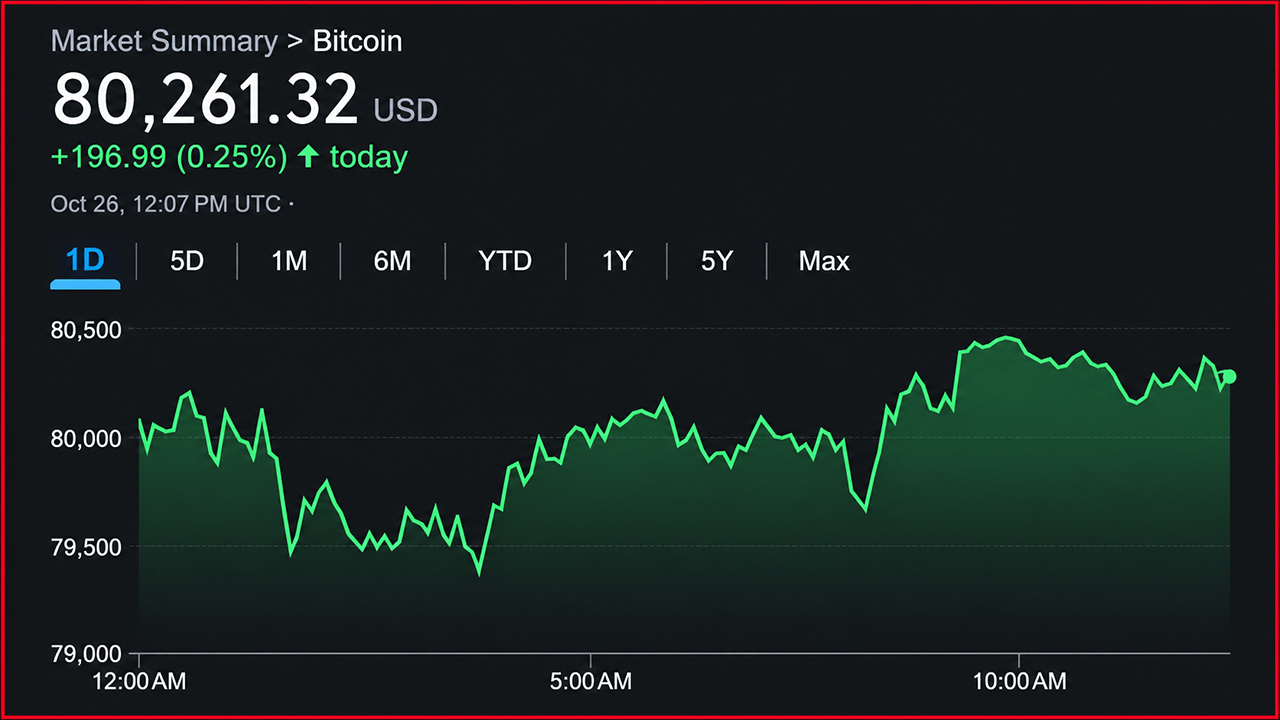
Bitcoin’s price is staging a spirited fight around $80,000 on Monday morning but the charts suggest the bulls haven’t wrestled control away from the bears just yet. With BTC changing hands near $80,273, a market capitalization of $1.614 trillion, and $20.136 billion in 24-hour trading volume, the world’s leading crypto asset finds itself trapped between a potentially explosive recovery and another punishing retreat toward $79,146, the recent swing low that now serves as the market’s most consequential downside threshold.
Hourly Chart Puts $80,900 in the Spotlight
The one-hour chart offers the bulls a glimmer of hope after bitcoin bounced from approximately $79,260 and fought its way back toward $80,250. Yet the recovery is encountering resistance between $80,500 and $80,900, where sellers have an opportunity to slam the door on the rebound.
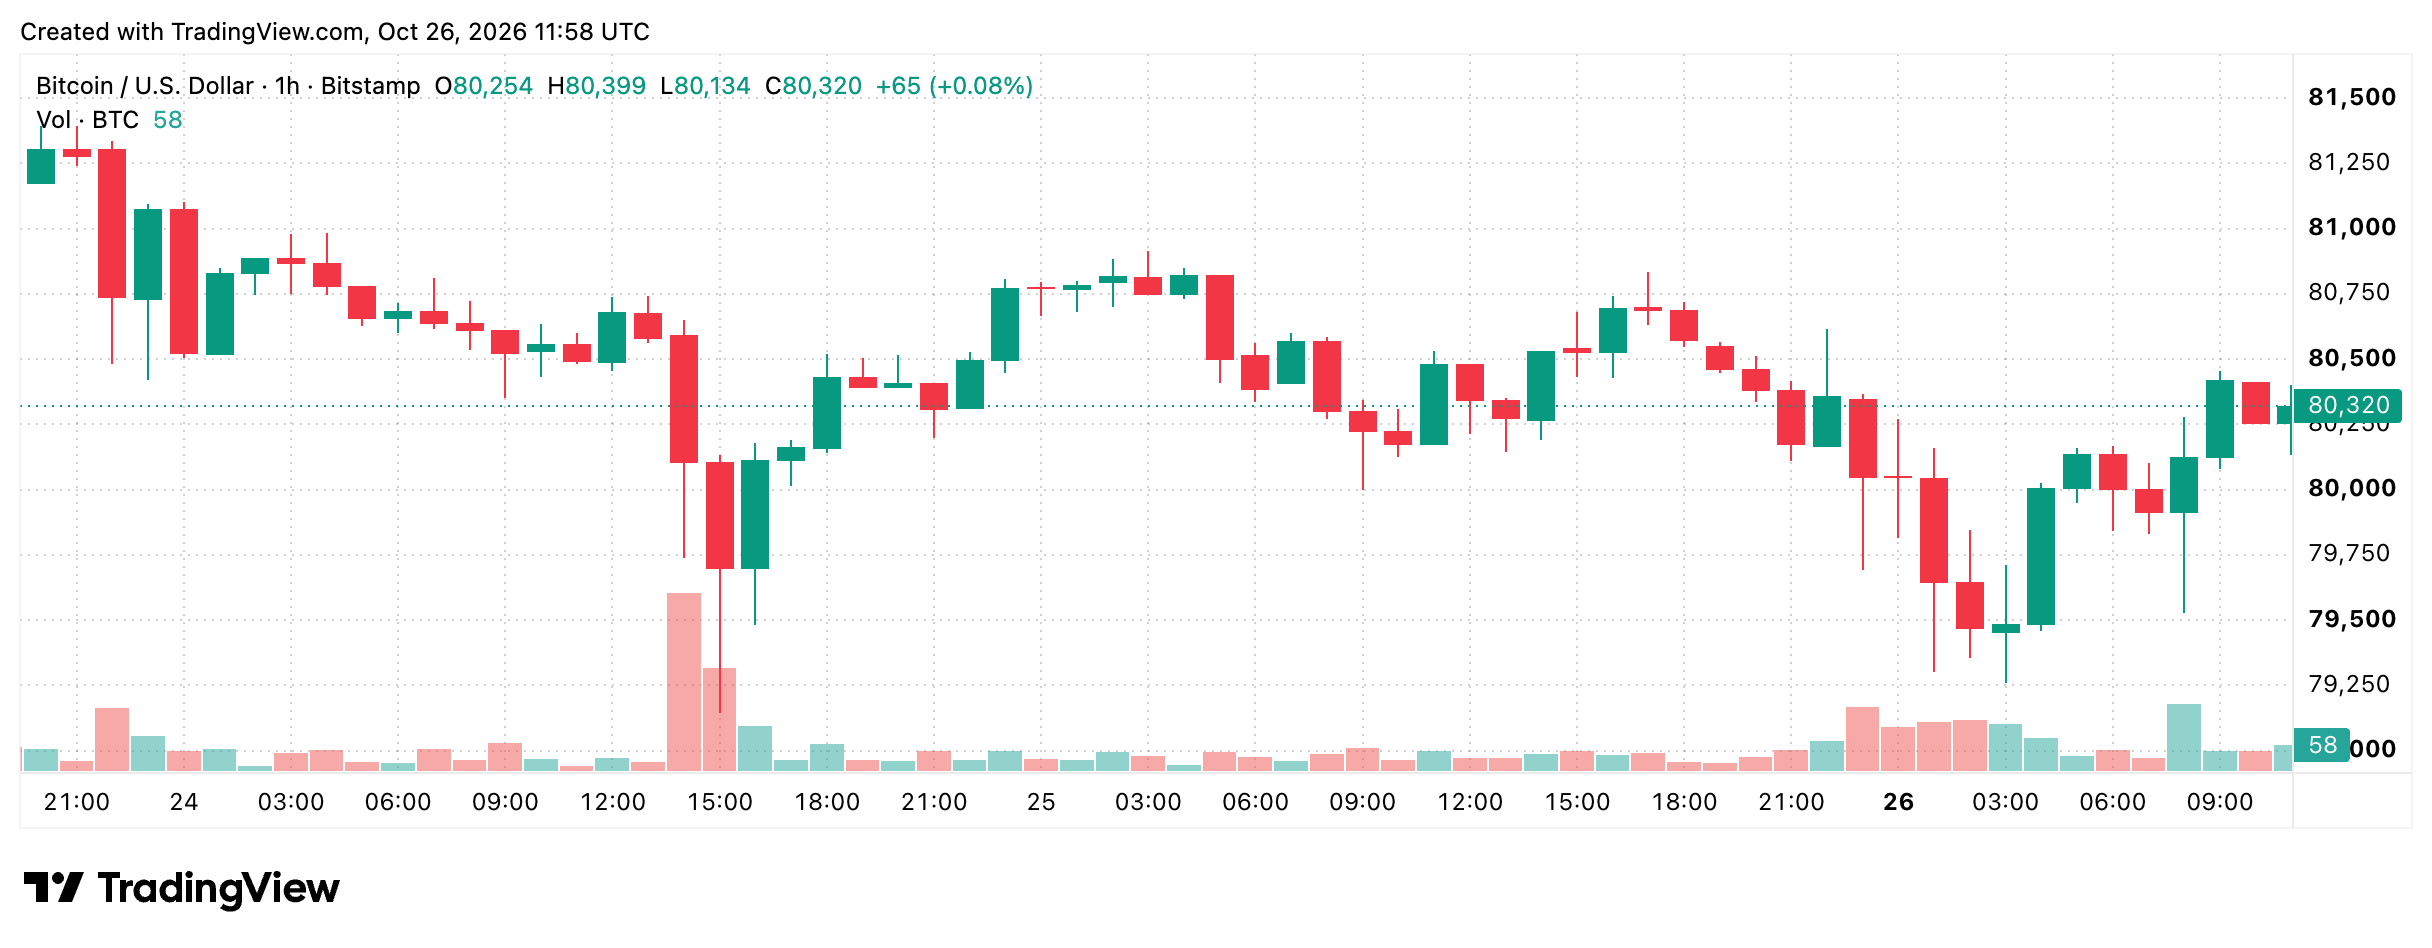
A convincing close above $80,900 would strengthen the case for an advance toward $81,500 and potentially $82,000. Rejection, however, would expose $79,500 and place the $79,146 swing low squarely back in focus.
Four-Hour Chart Reveals a Battered Market
The four-hour chart tells a less flattering story, chronicling bitcoin’s retreat from $84,843 to $79,146 before buyers finally mounted a counterattack. That recovery has introduced some stability, but it hasn’t erased the damage inflicted by the preceding decline.
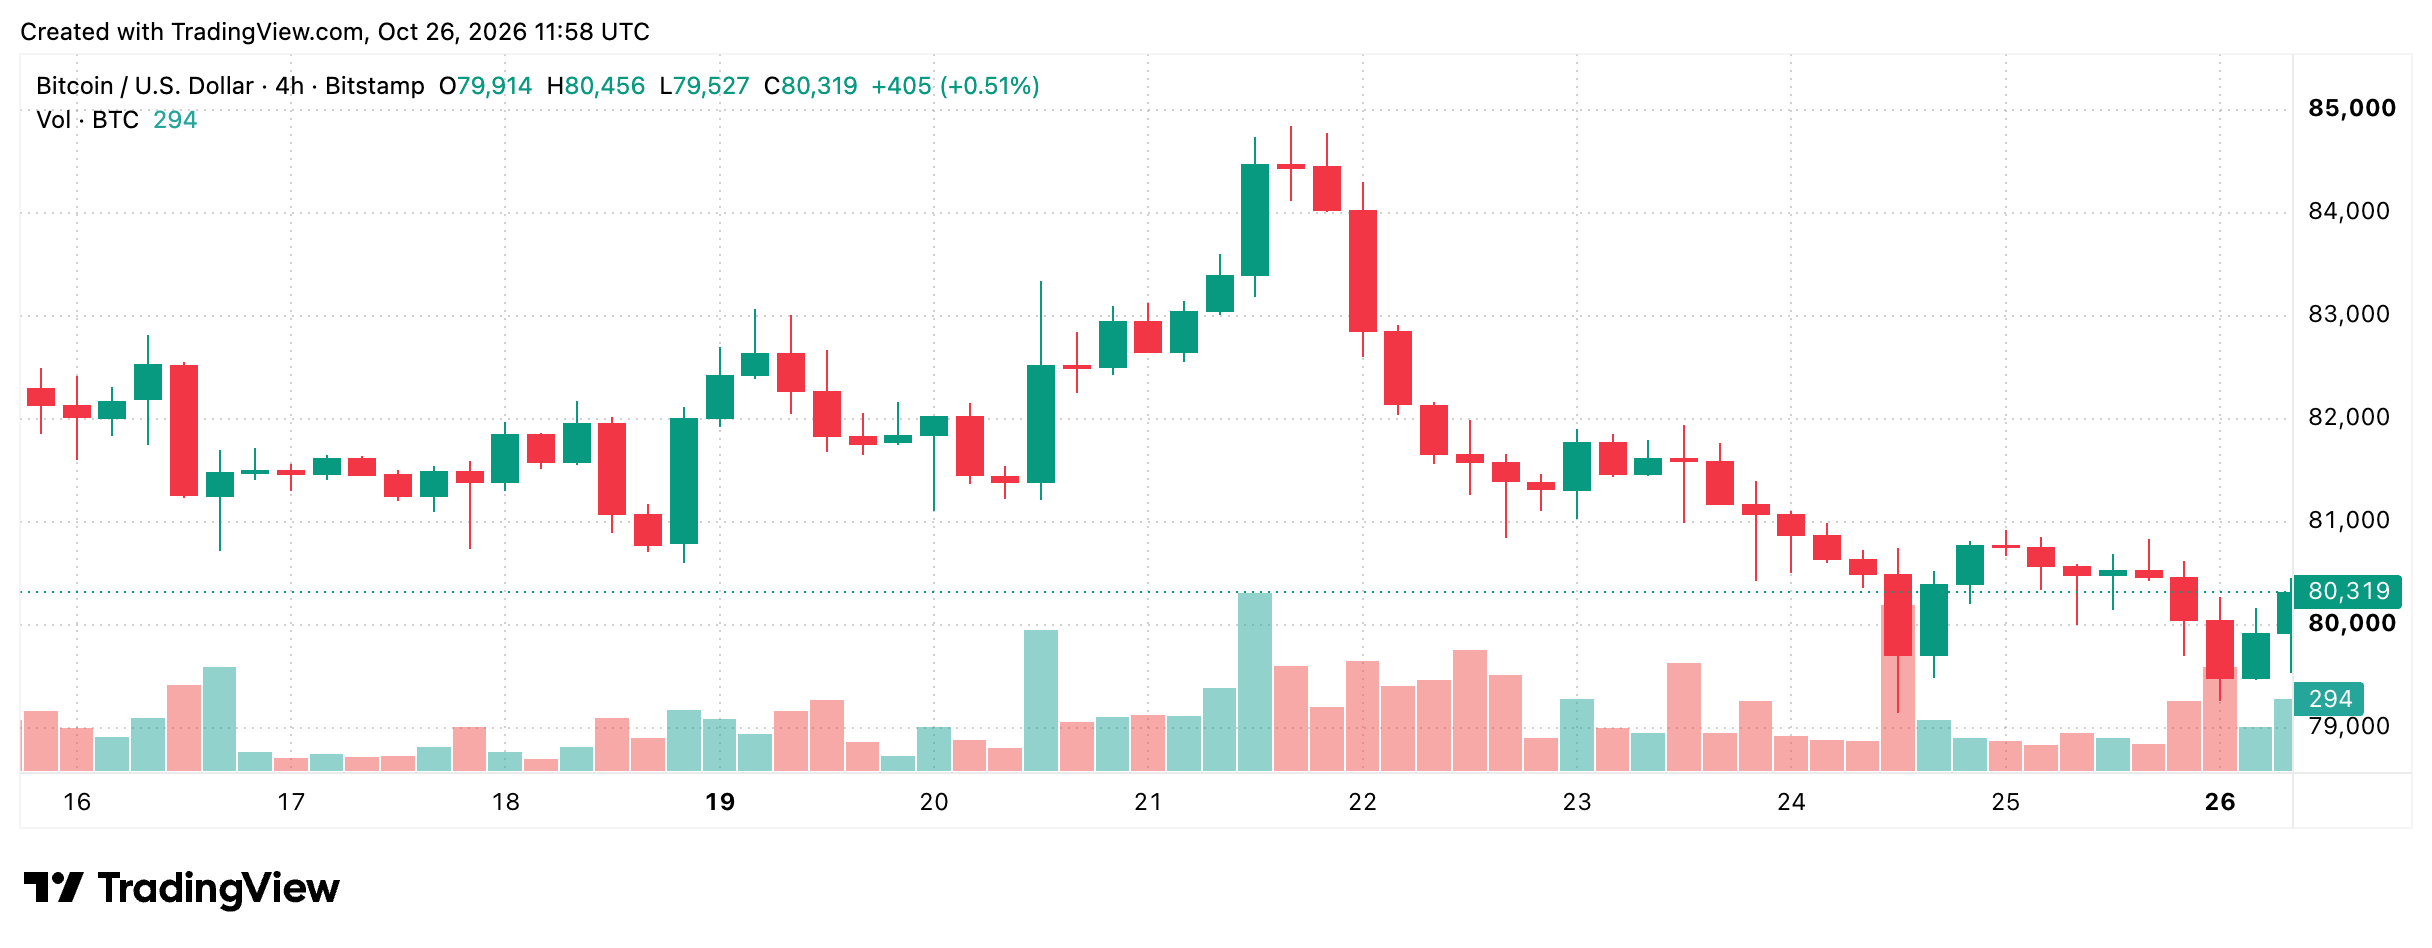
Resistance between $80,500 and $81,000 remains formidable, and a failed attempt to reclaim that territory would give sellers another opportunity to press their advantage. Losing $79,146 would put $78,500 and $78,000 on the radar as prospective downside targets rather than confirmed support.
Daily Chart Keeps the Bears in Command
Zooming out to the daily chart, bitcoin’s retreat from the $87,374 peak has produced a sequence of lower highs, leaving the broader structure tilted toward the bears. The latest green candle suggests buyers are defending the psychologically important $80,000 level, but one positive session hardly constitutes a trend reversal.
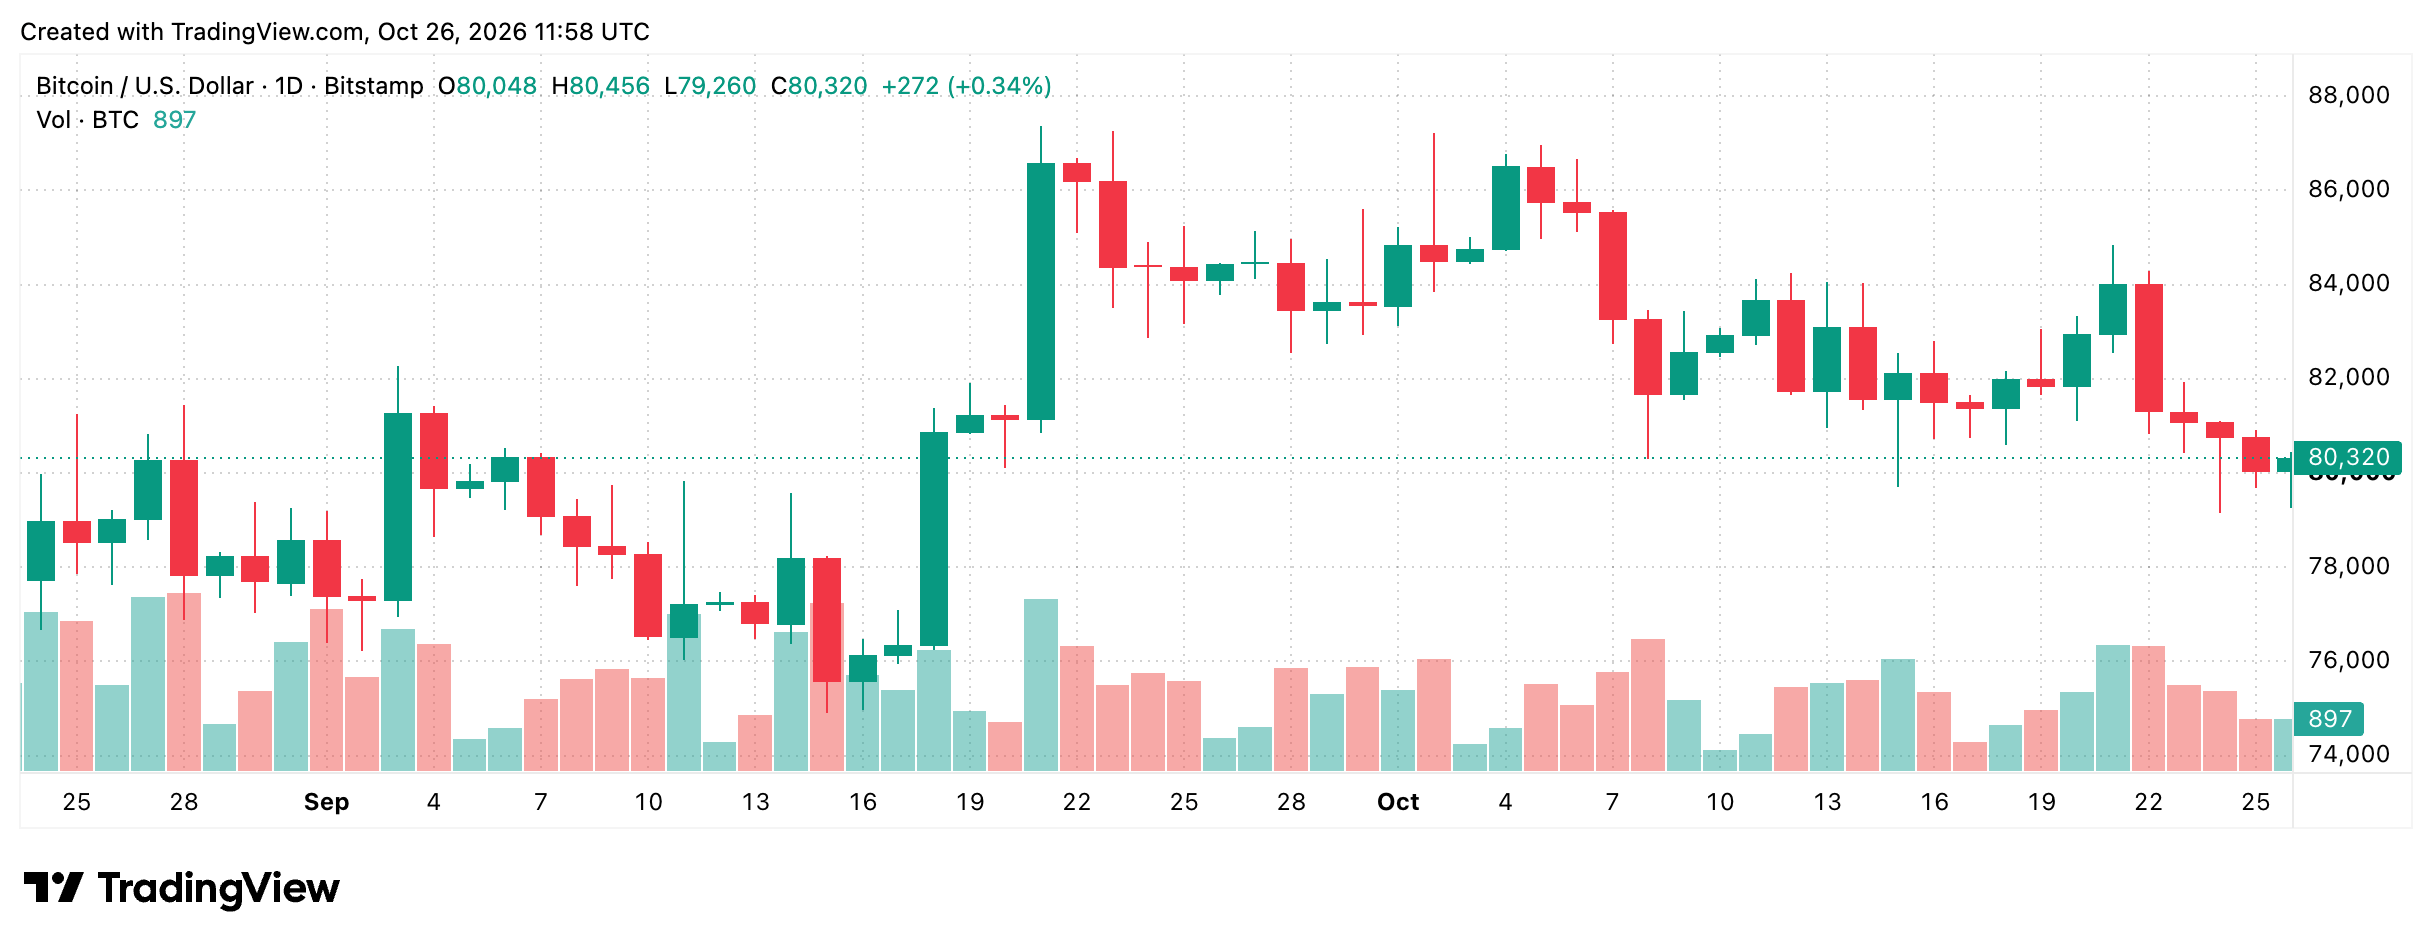
Bulls really need to reclaim $82,000 before entertaining a serious challenge of $84,000. Until then, every rebound risks becoming another selling opportunity, particularly if the market revisits the $79,146 floor.
Oscillators Hint at a Possible Counterattack
The daily chart’s oscillator tape is less decisively bearish than the price structure, with eight neutral readings, two positive signals, and one negative. The relative strength index (RSI) stands at 43, while the average directional index (ADX) registers just 18, suggesting limited trend strength. The Stochastic RSI at 3 and momentum reading of negative 1,175 carry positive signals, offering rebound potential. Yet moving average convergence divergence (MACD) remains negative at minus 413, warning that the bulls still lack convincing momentum.
Moving Averages Expose the Market’s Fault Line
The 24 hour moving average (MA) readout delivers the clearest warning, with nine negative signals against five positive readings and one neutral. Bitcoin trades below its 50-period exponential moving average (EMA) at $80,746 and 10-period EMA at $81,342, placing immediate obstacles above the market. However, the 100-period EMA at $77,636 and 200-period EMA at $76,304 remain beneath spot prices, preserving a longer-term bullish foundation. The dividing line is unmistakable: short-term weakness persists even as longer-term support survives.
| Bull Verdict | Bear Verdict |
|---|---|
| Bitcoin’s bulls have a fighting chance, but reclaiming $80,900 is essential to turning this tentative recovery into a meaningful advance. A decisive breakout would put $81,500 and $82,000 in the crosshairs, with $84,000 emerging as the next major objective. Holding above $79,146 keeps the bullish recovery thesis intact, while improving momentum could force short-term sellers to reconsider their positions. | The bears still command the technical high ground, with nine moving averages flashing negative signals and resistance stacked between $80,500 and $80,900. Failure to reclaim that territory would leave bitcoin vulnerable to another retreat toward $79,146. A confirmed breakdown beneath that critical floor could accelerate selling pressure toward $78,500 and eventually $78,000, extending the market’s recent sequence of lower highs. |