

Bitcoin price is in bear hands today and yesterday. BTC is currently hovering around $88,000 and trading at 20% below the ATH of $109,900 at the time of writing.
When crypto sees a drop like this, fear can overcome rationality and reason. A good trader must keep a level head and avoid involving emotions, not FOMOing into trades. The best way to do that is by doing an analysis again and again.
Look at the date of CZ’s tweet below! On Dec 17th, 2020, the daily candle on Bitcoin closed at $22,780.
Many people found it unbelievable that BTC would reach such prices back then. As it turns out, it had a few more x’s before topping out at $69,000.
Waiting for the new headline: #Bitcoin “CRASHES” from $101,000 to $85,000.
Save the tweet.
— CZ
BNB (@cz_binance) December 17, 2020
DISCOVER: Crypto Trends For Bullrun
Bitcoin Price Analysis: BTC USD Analysis Before Catalysis
What do you mean, bro, what catalysis?
Catalysis in chemistry is the process of adding a catalyst to facilitate a reaction.
In trading, fear is the catalyst to FOMOing into trades. You know what FOMO means.
A decision driven by fear is rarely a good decision. It’s rather a reaction.
As I wrote above, the best way to avoid doing that is by opening the charts and starting to draw lines. Before continuing, please revisit my previous article.
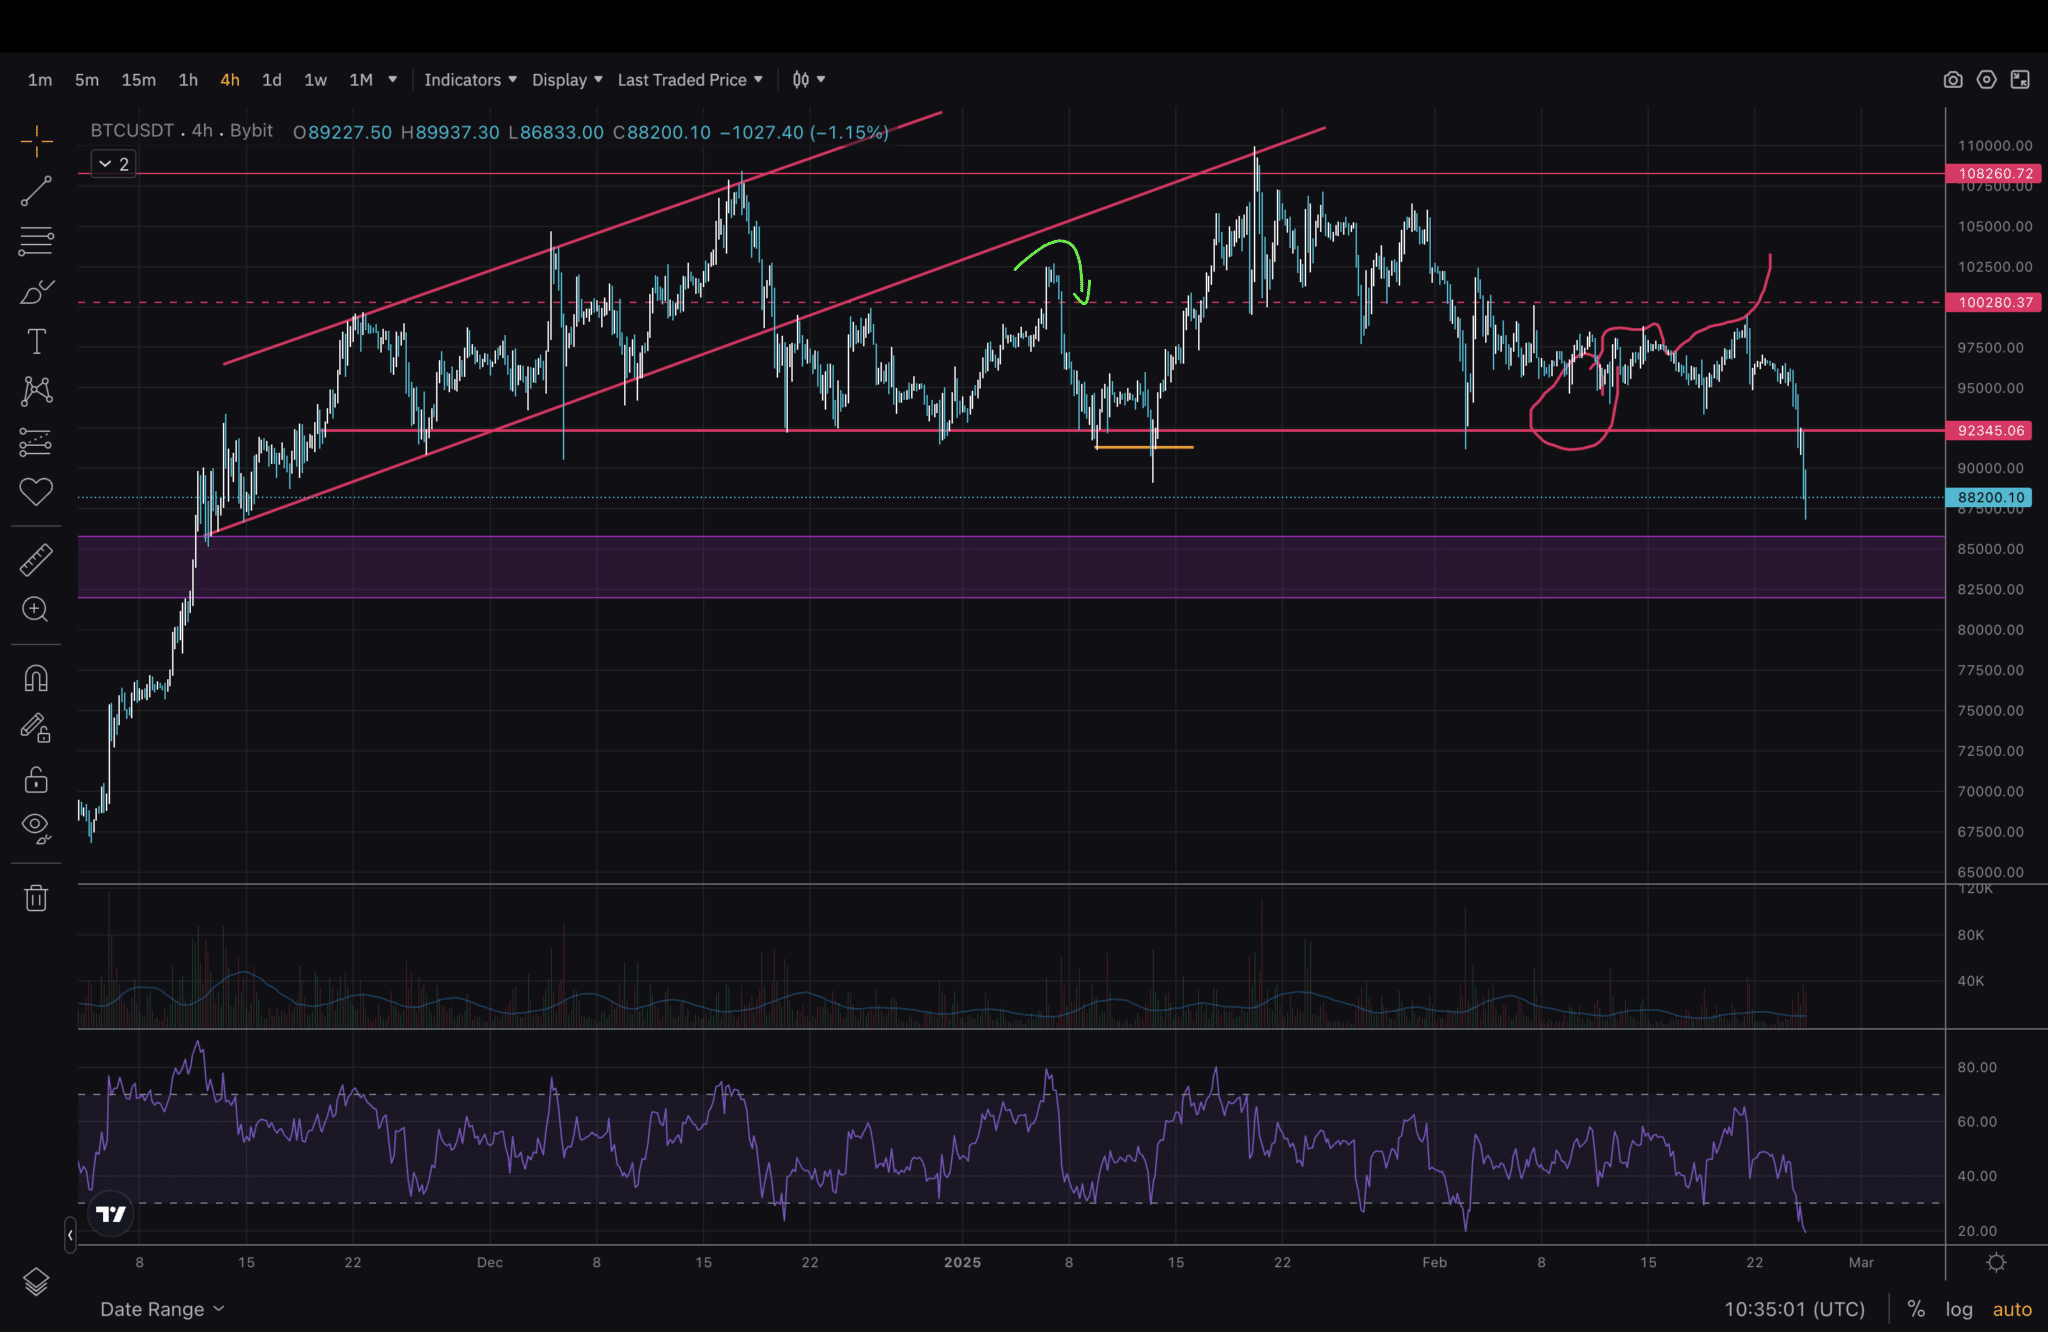
(BTCUSDT)
Today, we will start by taking a closer look and gradually zoom out. The 4H chart shows a sharp price drop after it broke below the support line of $92,400.
If you opened the previous article, you saw the green arrow was where the price was at. Since then, there has been a fake breakdown of support, reclaim, and another run towards the highs. It successfully fooled people into entering long positions.
Following the chart, the price went back to support, and it looked like it was going to push above the mid-range, but instead, it reversed swiftly. As a result, longs have been getting liquidated or closed yesterday and today. The liquidated longs exceed $1,300,000,000!
Lastly, in this timeframe, we see that RSI is in the oversold area.

(BTCUSDT)
Bitcoin’s Bullish BTC USD Structure Not Broken
Next, we look at the Daily chart. The purple box is the gap on the left, which I discussed in my previous article. It did not look like the Bitcoin price would drop to that level, but things changed quickly in just two days! And now it looks like this could be a possible reversal area.
Peeking at RSI again, it’s entering oversold now, too. The line at $73,500 is the high from the Spring of last year, which was tested again before the price broke and entered discovery. This is the lowest I’d like the price to go, not lower – in order to maintain a bullish structure.

(BTCUSDT)
Next, just a quick look over Fib Retracement on the 1D. A classical tool that works well for crypto analysis. It aligns to a high degree with the levels in the previous chart. 0.618 would be a great level to bounce off, as it sits in the middle of that gap.

(BTCUSDT)
Last, we’re zooming out the furthest, looking at the Weekly chart. The RSI bearish divergence was one signal to consider this retrace a possibility. Another is the four wicks above $104,600 and the inability to close above.
Swing failure and deviations are what happened up there. Nevertheless, this chart looks the best in terms of trend. I’ll be keeping an eye on the 40-45 RSI level to hold.
EXPLORE: Best Decentralised Exchanges
Key Takeaways From Bitcoin Price Analysis
- Bitcoin is still in bullish trend despite upwards of 1.3 billion worth of long liquidations.
- Key area between 82,000 and $86,000 .
- BTC price bulls want to keep price above $73,000, which is ways below.
The post Bitcoin Price Heads South: Where Can BTC USD Find a Bottom? appeared first on 99Bitcoins.